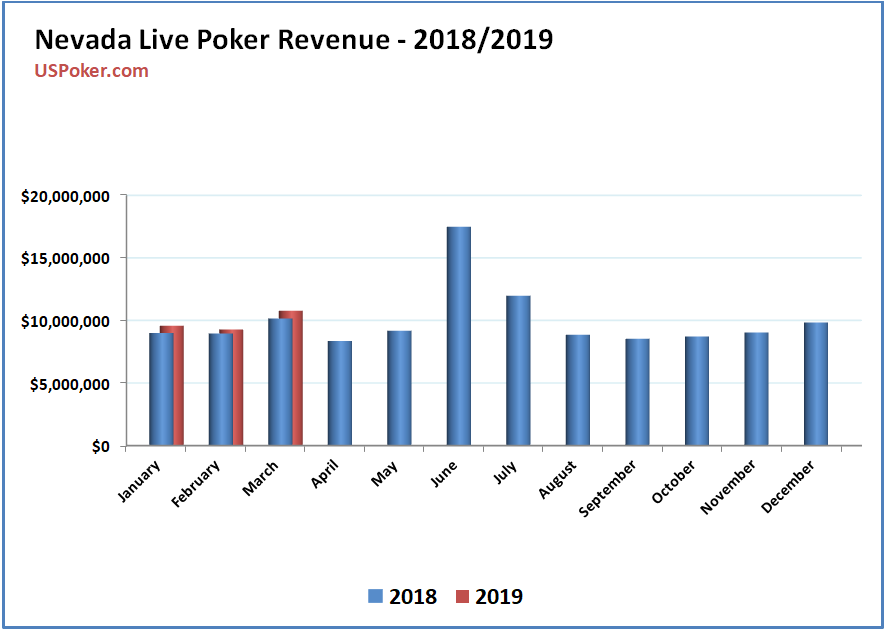
Three months into 2019, it appears Nevada’s poker industry is on pace to post one of its best years in recent memory. As USPoker detailed last month, the trend is likely due to poker rooms becoming far more efficient.
March 2019 saw poker revenues climb for the third consecutive month, and all three gains have been significant.
2019 Y/Y revenue changes:
- January 2019: +6.52%
- February 2019: +3.79%
- March 2019: +6.30%
New Players Get A Free Bonus At WSOP.com NJ
-
 Visit WSOP NJ
- $10 No Deposit100% to $1,000 With Deposit
- WSOP NJ ReviewOverall Grade A-
- Games B+
- Support B
- Banking A-
- Player Value A
A look inside this month’s revenue numbers
The Nevada Gaming Control Board counted 57 poker rooms and 556 poker tables in its latest monthly report. That’s an increase of two rooms and 10 tables compared to February. That said, the state counted 62 poker rooms and 567 poker tables in March 2018.
On a per table basis, March 2019 outperformed March 2018:
- March 2018 table average: $17,908
- March 2019 table average: $19,385
2018/2019 live poker revenue in Nevada

Has the market found its floor?
The poker inventory (rooms and tables) has leveled off following a systematic decline dating back several years.
Over the past seven months, Nevada’s poker rooms have experienced miniscule changes. During that time, the number of poker tables has fallen between 548-561, while the number of poker rooms has fluctuated between 55-58.
Both of these trends indicate the Nevada poker market has found a floor of 55-60 poker rooms and around 550 tables.
3- and 12-month poker room and table trend
Over the last three months, Nevada has averaged 550 poker tables at 57 separate locations. Those rooms generated $29,669,000 over that period, a 5.68% increase compared to the same period last year.
Over the last 12 months Nevada has averaged 594 poker tables at 63 locations. During that time the state’s poker operators have generated $121,607,000, a 2.12 percent increase compared to the previous 12-month period.
- April 2018: 64 poker rooms and 595 poker tables
- May 2018: 62 poker rooms and 688 poker tables
- June 2018: 62 poker rooms and 683 poker tables
- July 2018: 60 poker rooms and 694 poker tables
- August 2018: 61 poker rooms and 585 poker tables
- September 2018: 58 poker rooms and 561 poker tables
- October 2018: 56 poker rooms and 558 poker tables
- November 2018: 58 poker rooms and 561 poker tables
- December 2018: 56 poker rooms and 553 poker tables
- January 2019: 57 poker rooms and 548 poker tables
- February 2019: 55 poker rooms and 546 poker tables
- March 2019: 57 poker rooms and 556 poker tables

Nevada poker rooms by the numbers
The largest poker rooms in Las Vegas are mainly found on the Las Vegas Strip:
- Venetian (The Strip) – 37 poker tables
- Bellagio (The Strip) – 37 poker tables
- Orleans (Las Vegas off-strip)- 35 poker tables
- Wynn (The Strip) – 28 poker tables
- Aria (The Strip) – 24 poker tables
- South Point Casino (Henderson) – 22 poker tables
- Green Valley Ranch Casino (Henderson) – 22 poker tables
- Red Rock Casino (Summerlin) – 20 tables
Historical data and trends of poker in Nevada
Here’s a look at several key poker metrics from the UNLV Center for Gaming Research, which has been tracking the number of poker rooms, tables and revenue since 1992:
| Year | # of Rooms | # of Tables | Total Revenue | % Change YoY |
|---|---|---|---|---|
| 1992 | 92 | 564 | 74,701,000 | -2.57 |
| 1993 | 89 | 571 | 70,814,000 | -5.20 |
| 1994 | 93 | 586 | 71,667,000 | 1.20 |
| 1995 | 92 | 574 | 66,520,000 | -7.18 |
| 1996 | 82 | 539 | 64,485,000 | -3.06 |
| 1997 | 77 | 490 | 61,509,000 | -4.61 |
| 1998 | 76 | 526 | 58,873,000 | -4.29 |
| 1999 | 70 | 546 | 63,244,000 | 7.41 |
| 2000 | 68 | 473 | 63,064,000 | -0.28 |
| 2001 | 65 | 475 | 59,673,000 | -5.38 |
| 2002 | 57 | 386 | 57,791,000 | -3.15 |
| 2003 | 58 | 383 | 68,276,000 | 18.15 |
| 2004 | 79 | 484 | 98,862,000 | 44.80 |
| 2005 | 96 | 701 | 140,224,000 | 42.00 |
| 2006 | 106 | 886 | 160,929,000 | 14.77 |
| 2007 | 113 | 907 | 167,975,000 | 4.38 |
| 2008 | 113 | 913 | 155,724,000 | -7.29 |
| 2009 | 114 | 905 | 145,580,000 | -6.54 |
| 2010 | 109 | 920 | 135,200,000 | -7.13 |
| 2011 | 104 | 872 | 131,877,000 | -2.46 |
| 2012 | 99 | 809 | 123,253,000 | -6.54 |
| 2013 | 88 | 774 | 123,891,000 | 0.56 |
| 2014 | 79 | 736 | 119,904,000 | -3.18 |
| 2015 | 76 | 681 | 118,023,000 | -1.57 |
| 2016 | 73 | 661 | 117,753,000 | -0.18 |
| 2017 | 71 | 615 | 118,455,000 | 0.60 |
| 2018 | 62 | 599 | 120,010,000 | 1.33 |
The post 2019 Is Shaping Up To Be A Great Year For Nevada Poker Rooms appeared first on .
