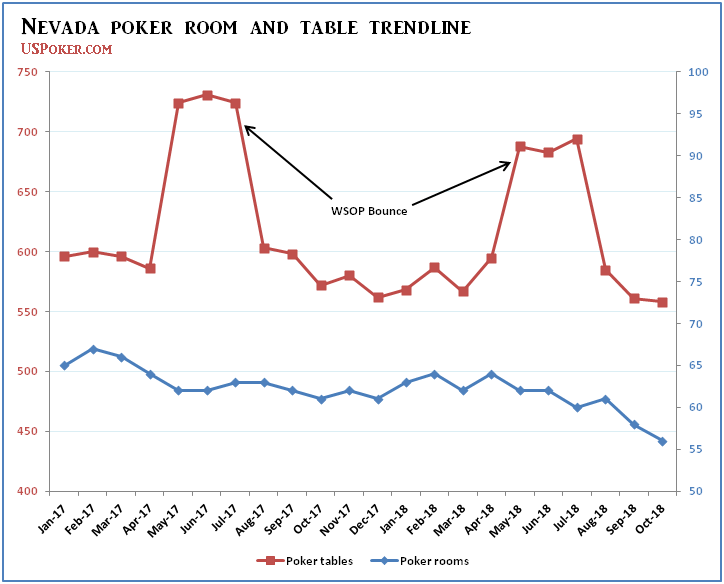
The Holmesian case of the disappearing poker rooms continues to go unsolved in Nevada. The state shed even more rooms and tables in October, as the Nevada Gaming Control Board counted 56 poker rooms and 558 poker tables for the month.
That’s two fewer rooms and three fewer tables than the state possessed in September, and five fewer rooms and 14 fewer tables than October 2017.
Like a random sock going missing every time I do a load of laundry, the reduction in poker rooms and tables is part of an ongoing, and difficult-to-explain trend in Nevada.
And if the situation wasn’t peculiar enough, despite the loss of inventory, revenue has risen more often than not over the last 12 months. More so, it’s rising by a significant margin when viewed on a per table basis.
That could signal a right-sizing of the poker market in the state.
Top line numbers
The number of poker rooms in the state of Nevada is now at pre-poker-boom levels. The number of tables has fallen to its lowest point since the mid 1990s.
Yet poker revenue is double what it was during the lean years of the 1990s and early 2000s.
You can find a full annual breakdown of poker rooms, tables, and revenue at the end of the column.
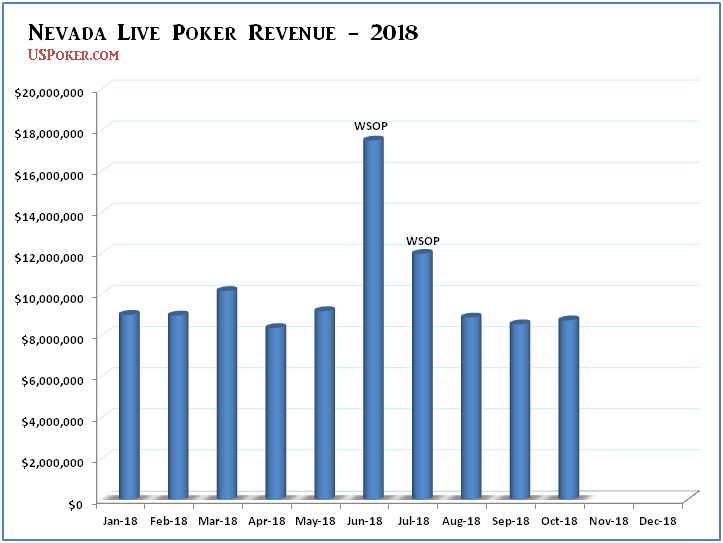
Poker revenue was down just a tick in October, coming in at $8.725 million compared to the $8.736 million the state’s poker operators generated last October.
On a per table basis, revenue was up Y/Y:
- October 2017 table average: $15,272
- October 2018 table average: $15,636
2018 live poker revenue in Nevada

3- and 12-month poker room and table trend
Over the last three months, Nevada has averaged 591 poker tables at 64 separate locations. Those rooms generated $26,044,000 over that period, a 2.59 percent increase compared to the same period last year.
Over the last 12 months, Nevada has averaged 622 poker tables at 71 locations. During that time the state’s poker operators have generated $118,270,000, a .04 percent increase compared to the previous 12-month period.
- November 2017: 62 poker rooms and 580 poker tables
- December 2017: 61 poker rooms and 562 poker tables
- January 2018: 63 poker rooms and 568 poker tables
- February 2018: 64 poker rooms and 587 poker tables
- March 2018: 62 poker rooms and 567 poker tables
- April 2018: 64 poker rooms and 595 poker tables
- May 2018: 62 poker rooms and 688 poker tables
- June 2018: 62 poker rooms and 683 poker tables
- July 2018: 60 poker rooms and 694 poker tables
- August 2018: 61 poker rooms and 585 poker tables
- September 2018: 58 poker rooms and 561 poker tables
- October 2018: 56 poker rooms and 558 poker tables

Nevada poker rooms by the numbers
- The largest poker rooms in Las Vegas are mainly found on the Las Vegas Strip:
- Venetian (The Strip) – 37 poker tables
- Bellagio (The Strip) – 37 poker tables
- Orleans (Las Vegas off-strip)- 35 poker tables
- Wynn (The Strip) – 28 poker tables
- Aria (The Strip) – 24 poker tables
- South Point Casino (Henderson) – 22 poker tables
- Green Valley Ranch Casino (Henderson) – 22 poker tables
- Red Rock Casino (Summerlin) – 20 tables
Historical data and trends of poker in Nevada
Here’s a look at several key poker metrics from the UNLV Center for Gaming Research, which has been tracking the number of poker rooms, tables and revenue since 1992:
| Year | # of Rooms | # of Tables | Total Revenue | % Change YoY |
|---|---|---|---|---|
| 1992 | 92 | 564 | 74,701,000 | -2.57 |
| 1993 | 89 | 571 | 70,814,000 | -5.20 |
| 1994 | 93 | 586 | 71,667,000 | 1.20 |
| 1995 | 92 | 574 | 66,520,000 | -7.18 |
| 1996 | 82 | 539 | 64,485,000 | -3.06 |
| 1997 | 77 | 490 | 61,509,000 | -4.61 |
| 1998 | 76 | 526 | 58,873,000 | -4.29 |
| 1999 | 70 | 546 | 63,244,000 | 7.41 |
| 2000 | 68 | 473 | 63,064,000 | -0.28 |
| 2001 | 65 | 475 | 59,673,000 | -5.38 |
| 2002 | 57 | 386 | 57,791,000 | -3.15 |
| 2003 | 58 | 383 | 68,276,000 | 18.15 |
| 2004 | 79 | 484 | 98,862,000 | 44.80 |
| 2005 | 96 | 701 | 140,224,000 | 42.00 |
| 2006 | 106 | 886 | 160,929,000 | 14.77 |
| 2007 | 113 | 907 | 167,975,000 | 4.38 |
| 2008 | 113 | 913 | 155,724,000 | -7.29 |
| 2009 | 114 | 905 | 145,580,000 | -6.54 |
| 2010 | 109 | 920 | 135,200,000 | -7.13 |
| 2011 | 104 | 872 | 131,877,000 | -2.46 |
| 2012 | 99 | 809 | 123,253,000 | -6.54 |
| 2013 | 88 | 774 | 123,891,000 | 0.56 |
| 2014 | 79 | 736 | 119,904,000 | -3.18 |
| 2015 | 76 | 681 | 118,023,000 | -1.57 |
| 2016 | 73 | 661 | 117,753,000 | -0.18 |
| 2017 | 71 | 615 | 118,455,000 | 0.60 |
| 2018 |
The post Nevada Poker Report October 2018: Revenue Remains Steady As Two More Poker Rooms Disappear appeared first on .
