A heated debate has developed on the Twittersphere, as Allen Kessler shared a bet for the ongoing WSOP and many players showed interest.


A heated debate has developed on the Twittersphere, as Allen Kessler shared a bet for the ongoing WSOP and many players showed interest.


The latest from the Pokerfuse Poker Podcast Directory.
The Bernard Lee Poker Show 05-29-18 with Guest Jack Effel


More than three times larger than last year’s event, the Online Championships makes up one part of WSOP’s massive $15 Million Summer.
While most of the attention may be on the World Series of Poker’s summer spectacle in Las Vegas, the WSOP has just quietly started the online component of the series and it blows every previous tournament series hosted on US soil out of the water by every metric.
The Online Championships—now in its fifth iteration—guarantees over $3 million in prize pools across 124 events. That is 3.5 times larger than last year’s $850,000 series and more than double the size of PokerStars’ NJSCOOP series held in April, previously the largest online poker tournament series in the regulated US poker markets.


The recent NJTHA lawsuit seeking $150M from the sports leagues for their part in preventing legal NJ sports betting at Monmouth Park is just one fallout from the Supreme Court’s May 14 sports betting decision.
The post NJ Sports Betting Lawsuit Against The Leagues Sparks A War Of Words appeared first on .
Party Poker is running a knockout promotion to celebrate its launch in the shared EU liquidity market. Simply eliminate the site’s French ambassador Bertrand “ElKy” Grospellier from tonight´s $20,000 guaranteed “Main Event” and you will be awarded a $5,300 seat in Party Poker´s MILLIONS Online event. The news that Party Poker was combining its French […]


Popular $5 buy-in millionaire-making Spin & Gos return to PokerStars for another limited edition run.
PokerStars, the world’s largest online poker room, has launched special Spin & Goal tournaments ahead of the world’s biggest sporting event, the FIFA World Cup.
Part of a slate of soccer-themed promotions running on PokerStars, Spin & Goal launched on Friday on its global dot-com client and in most of its European markets including UK, Spain, France, and Italy.
The 2018 World Series of Poker $1,500 Omaha eight-or-better event was originally scheduled to last only three days, with the planned finish of the event on Saturday, June 2. Late …
Fifty thousand casino workers won’t be striking in Las Vegas for better wages and job security as the world’s foremost poker festival enters its second week. A potential labor strike …
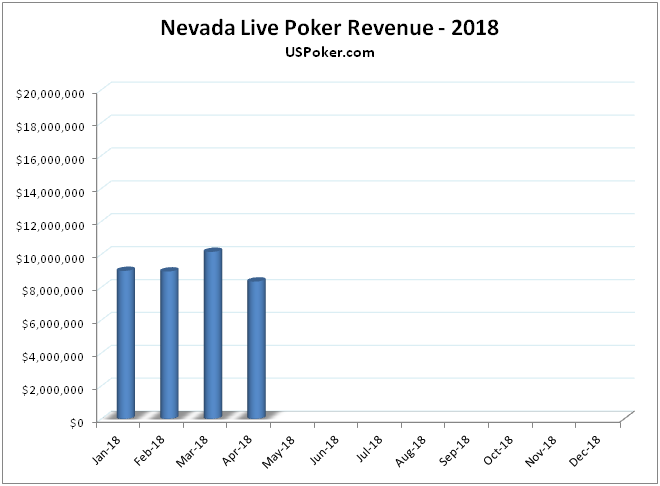
Nevada poker numbers are one of the more counterintuitive data sets you’ll come across. For well over a year the industry has seen revenue trending up while the number of poker rooms and poker tables trend down. April 2018 saw both trends reverse.
The Nevada Gaming Control Board reported a -1.09 percent year-over-year decrease in poker revenue for the month.
Poker revenue reached $8,350,000 in April, compared to $8,442,000 poker rooms collected in April 2017.
For the month, the NGCB counted 64 poker rooms and 595 tables. That’s a solid bump on both fronts compared to March’s 62 poker rooms and 567 poker tables. It’s also an increase over April 2017, when the state boasted 64 poker rooms and 586 tables, marking the first time in recent memory that the number of poker tables has increased year-over-year.
The bump could represent some rooms getting an early start on the summer tournament season. A World Poker Tour stop, the Super High Roller Bowl, and the World Series of Poker.
Not surprisingly, on a per table basis, April 2018 dropped off from last year’s numbers:

May 2017: 62 poker rooms and 724 poker tables
June 2017: 62 poker rooms and 731 poker tables
July 2017: 63 poker rooms and 724 poker tables
August 2017: 63 poker rooms and 603 poker tables
September 2017: 62 poker rooms and 598 poker tables
October 2017: 61 poker rooms and 572 poker tables
November 2017: 62 poker rooms and 580 poker tables
December 2017: 61 poker rooms and 562 poker tables
January 2018: 63 poker rooms and 568 poker tables
February 2018: 64 poker rooms and 587 poker tables
March 2018: 62 poker rooms and 567 poker tables
April 2018: 64 poker rooms and 595 poker tables

The NGCB counted 39 poker rooms and 479 poker tables in Clark County in the month of April, a 25-table increase over March. Clark County includes the heavily trafficked and larger poker rooms from Las Vegas.
As such, Clark County generates 90 percent of the total poker market share in Nevada. In April , Clark County poker rooms accounted for $7,555,000 of the $8,350,000 poker dollars collected by the state’s card rooms.
The 39 rooms and 479 tables is a slight increase Y/Y. In April 2017 Clark County’s 39 poker rooms possessed 471 poker tables.
New Players Get A Free Bonus At WSOP.com NJ
The Las Vegas Strip’s poker rooms make up the bulk of Clark County’s poker revenue. Las Vegas Strip poker rooms generated $5,238,000 in April, even though they only account for a fraction of the poker rooms and tables in the state, 19 and 270 respectively.
The largest poker rooms in Las Vegas are mainly found on the Las Vegas Strip:
Venetian (The Strip) – 37 poker tables
Bellagio (The Strip) – 37 poker tables
Orleans (Las Vegas off-strip)- 35 poker tables
Wynn (The Strip) – 28 poker tables
Aria (The Strip) – 24 poker tables
South Point Casino (Henderson) – 22 poker tables
Green Valley Ranch Casino (Henderson) – 22 poker tables
Red Rock Casino (Summerlin) – 20 tables
Here’s a look at several key poker metrics from the UNLV Center for Gaming Research, which has been tracking the number of poker rooms, tables and revenue since 1992:
| Year | # of Rooms | # of Tables | Total Revenue | % Change YoY |
| 1992 | 92 | 564 | 74,701,000 | -2.57 |
| 1993 | 89 | 571 | 70,814,000 | -5.20 |
| 1994 | 93 | 586 | 71,667,000 | 1.20 |
| 1995 | 92 | 574 | 66,520,000 | -7.18 |
| 1996 | 82 | 539 | 64,485,000 | -3.06 |
| 1997 | 77 | 490 | 61,509,000 | -4.61 |
| 1998 | 76 | 526 | 58,873,000 | -4.29 |
| 1999 | 70 | 546 | 63,244,000 | 7.41 |
| 2000 | 68 | 473 | 63,064,000 | -0.28 |
| 2001 | 65 | 475 | 59,673,000 | -5.38 |
| 2002 | 57 | 386 | 57,791,000 | -3.15 |
| 2003 | 58 | 383 | 68,276,000 | 18.15 |
| 2004 | 79 | 484 | 98,862,000 | 44.80 |
| 2005 | 96 | 701 | 140,224,000 | 42.00 |
| 2006 | 106 | 886 | 160,929,000 | 14.77 |
| 2007 | 113 | 907 | 167,975,000 | 4.38 |
| 2008 | 113 | 913 | 155,724,000 | -7.29 |
| 2009 | 114 | 905 | 145,580,000 | -6.54 |
| 2010 | 109 | 920 | 135,200,000 | -7.13 |
| 2011 | 104 | 872 | 131,877,000 | -2.46 |
| 2012 | 99 | 809 | 123,253,000 | -6.54 |
| 2013 | 88 | 774 | 123,891,000 | 0.56 |
| 2014 | 79 | 736 | 119,904,000 | -3.18 |
| 2015 | 76 | 681 | 118,023,000 | -1.57 |
| 2016 | 73 | 661 | 117,753,000 | -0.18 |
| 2017 | 71 | 615 | 118,455,000 | 0.60 |
The post Nevada Poker Report April 2018: The Calm Before The WSOP Storm appeared first on .
2009 World Series of Poker main event champion Joe Cada has won the third gold bracelet of his career, defeating a field of 363 entries to win the 2018 WSOP …