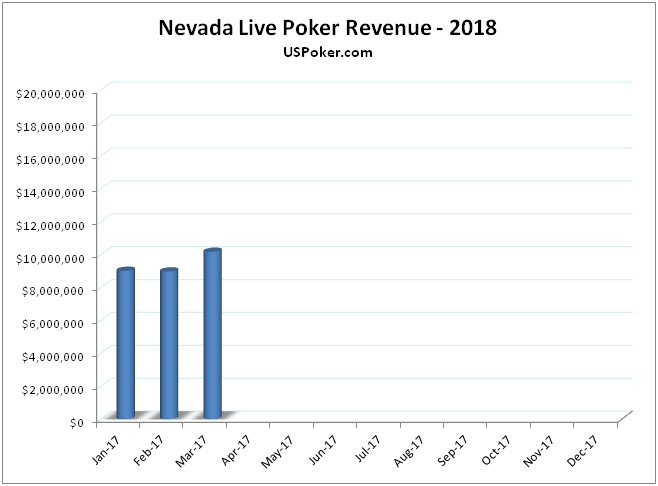
Las Vegas had another strong month in March, with total gaming revenue topping $1 billion for the third consecutive month. Poker only accounts for a fraction of that total, but it’s safe to say that Nevada poker rooms were buzzing in March.
The Nevada Gaming Control Board reported a 5.68 percent year-over-year increase in poker revenue for the month, marking the first time poker revenue surpassed $10 million in March since 2014.
Poker revenue reached $10,154,000 in March, compared $9,608,000 the state’s poker rooms collected in March 2017.
For the month, the NGCB counted 62 poker rooms and 567 tables, compared to 66 poker rooms and 596 poker tables the state boasted last year.
On a per table basis, March 2018 blew last year’s numbers out of the water:
- March 2017 table average: $16,121
- March 2018 table average: $17,908
2018 live poker revenue in Nevada

12-month poker room and table trend
- April 2017: 64 poker rooms and 586 poker tables
- May 2017: 62 poker rooms and 724 poker tables
- June 2017: 62 poker rooms and 731 poker tables
- July 2017: 63 poker rooms and 724 poker tables
- August 2017: 63 poker rooms and 603 poker tables
- September 2017: 62 poker rooms and 598 poker tables
- October 2017: 61 poker rooms and 572 poker tables
- November 2017: 62 poker rooms and 580 poker tables
- December 2017: 61 poker rooms and 562 poker tables
- January 2018: 63 poker rooms and 568 poker tables
- February 2018: 64 poker rooms and 587 poker tables
- March 2018: 62 poker rooms and 567 poker tables

Poker in Clark County
The NGCB counted 39 poker rooms and 454 poker tables in Clark County in the month of March. Clark County includes the heavily trafficked and larger poker rooms from Las Vegas.
Clark County can lay claim to 90 percent of the total poker market share in Nevada. In March, Clark County poker rooms accounted for $9,206,000 of the $10,154,000 poker dollars collected by the state’s card rooms.
The 39 rooms and 454 tables are a decline from a year ago when there were 40 poker rooms and 478 poker tables. It’s also a decrease of 17 tables compared to last month’s numbers. But like the state as a whole, Y/Y revenue was up significantly in Clark County. Despite 24 fewer tables, poker revenue rose 6.75 percent in March.
New Players Get A Free Bonus At WSOP.com NJ
-
 Visit WSOP NJ
- $10 No Deposit100% to $400 With Deposit
- WSOP NJ ReviewOverall Grade A-
- Games B+
- Support B
- Banking A-
- Player Value A
Poker on the Las Vegas Strip
The Las Vegas Strip’s poker rooms tallied $6,510,000 in March, even though the Strip only accounts for a fraction of the poker rooms and tables in the state, 18 and 260 respectively.
Nevada poker rooms by the numbers
The largest poker rooms in Las Vegas are mainly found on the Las Vegas Strip:
- Venetian (The Strip) – 37 poker tables
- Bellagio (The Strip) – 37 poker tables
- Orleans (Las Vegas off-strip)- 35 poker tables
- Wynn (The Strip) – 28 poker tables
- Aria (The Strip) – 24 poker tables
- South Point Casino (Henderson) – 22 poker tables
- Green Valley Ranch Casino (Henderson) – 22 poker tables
- Red Rock Casino (Summerlin) – 20 tables
Historical data and trends of poker in Nevada
Here’s a look at several key poker metrics from the UNLV Center for Gaming Research, which has been tracking the number of poker rooms, tables and revenue since 1992:
| Year | # of Rooms | # of Tables | Total Revenue | % Change YoY |
| 1992 | 92 | 564 | 74,701,000 | -2.57 |
| 1993 | 89 | 571 | 70,814,000 | -5.20 |
| 1994 | 93 | 586 | 71,667,000 | 1.20 |
| 1995 | 92 | 574 | 66,520,000 | -7.18 |
| 1996 | 82 | 539 | 64,485,000 | -3.06 |
| 1997 | 77 | 490 | 61,509,000 | -4.61 |
| 1998 | 76 | 526 | 58,873,000 | -4.29 |
| 1999 | 70 | 546 | 63,244,000 | 7.41 |
| 2000 | 68 | 473 | 63,064,000 | -0.28 |
| 2001 | 65 | 475 | 59,673,000 | -5.38 |
| 2002 | 57 | 386 | 57,791,000 | -3.15 |
| 2003 | 58 | 383 | 68,276,000 | 18.15 |
| 2004 | 79 | 484 | 98,862,000 | 44.80 |
| 2005 | 96 | 701 | 140,224,000 | 42.00 |
| 2006 | 106 | 886 | 160,929,000 | 14.77 |
| 2007 | 113 | 907 | 167,975,000 | 4.38 |
| 2008 | 113 | 913 | 155,724,000 | -7.29 |
| 2009 | 114 | 905 | 145,580,000 | -6.54 |
| 2010 | 109 | 920 | 135,200,000 | -7.13 |
| 2011 | 104 | 872 | 131,877,000 | -2.46 |
| 2012 | 99 | 809 | 123,253,000 | -6.54 |
| 2013 | 88 | 774 | 123,891,000 | 0.56 |
| 2014 | 79 | 736 | 119,904,000 | -3.18 |
| 2015 | 76 | 681 | 118,023,000 | -1.57 |
| 2016 | 73 | 661 | 117,753,000 | -0.18 |
| 2017 | 71 | 615 | 118,455,000 | 0.60 |
The post Nevada Poker Report March 2018: Nevada Poker Rooms Set The Stage For A Big Summer appeared first on .


