For the past several years, Nevada poker has been one of the most interesting verticals to track.
Alarmingly, more poker rooms and poker tables are disappearing in the state each month. At the same time, revenues continue to grow. In other words, Nevada casinos are becoming far more efficient in their poker operations.
A look inside this month’s Nevada poker revenue numbers
In January 2019, the Nevada Gaming Control Board counted 58 poker rooms and 548 poker tables. That’s a loss of five poker rooms and 20 tables compared to January 2018.
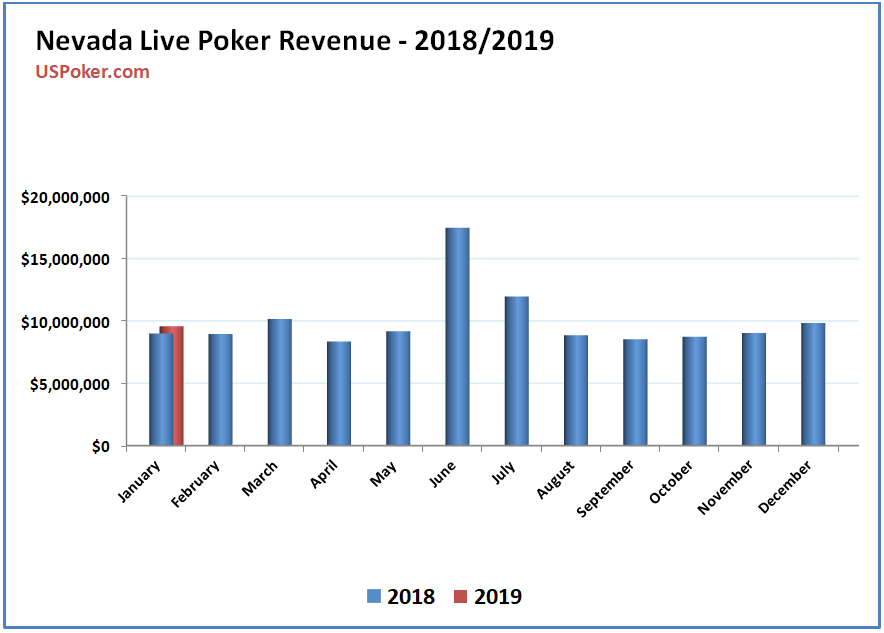
However, Nevada’s poker rooms are beating last year’s revenue numbers. In January 2019, they did so significantly by 6.52 percent.
So, in terms of numbers, Nevada’s poker rooms generated $9.58 million in January 2019. That’s the best January tally the state has posted since 2015 when it boasted 72 poker rooms and 678 poker tables.
The efficiency in 2019 is even more evident when January 2015 is compared with January 2019 on a per table basis:
- January 2015 table average: $14,238
- January 2019 table average: $17,485
Attrition is hitting Las Vegas hard
Statewide, Nevada has lost 20 percent of its poker rooms and 15 percent of its poker tables since January 2015. Though this may seem obvious, the biggest losses have been in Clark County (Las Vegas) and the Las Vegas Strip.
For instance, Clark County has shed 23 percent of its poker rooms and 21 percent of its poker tables over the same period of time:
- Clark County, January 2015: 47 poker rooms and 556 poker tables
- Clark County, January 2019: 35 poker rooms and 437 poker tables
If we zoom in on the Las Vegas Strip, the decreases jump to 26 percent and 23 percent:
- January 2015: 23 poker rooms and 328 poker tables
- January 2015: 17 poker rooms and 252 poker tables
New Players Get A Free Bonus At WSOP.com NJ
-
Visit WSOP NJ
- $10 No Deposit100% to $1,000 With Deposit
- WSOP NJ ReviewOverall Grade A-
- Games B+
- Support B
- Banking A-
- Player Value A
Three-month and 12-month Nevada poker room and table trends
Over the last three months, Nevada has averaged 554 poker tables at 58 separate locations. In that time, those rooms generated $28,467,000, a 3.65 percent increase compared to the same period last year.
For the last 12 months, Nevada has averaged 598 poker tables at 63 locations. During that time, the state’s poker operators have generated $120,598,000 — a 1.81 percent increase compared to the previous 12-month period.
The year’s high point occurred in July 2018, when there were 694 poker tables active in 60 poker rooms. Unsurprisingly, the state’s busiest time for poker coincides with the World Series of Poker.
Nevada poker rooms by the numbers
The largest poker rooms in Las Vegas are mainly found on the Strip:
- Venetian (the Strip): 37 poker tables
- Bellagio (the Strip): 37 poker tables
- Orleans (Las Vegas off-strip): 35 poker tables
- Wynn (the Strip): 28 poker tables
- Aria (the Strip): 24 poker tables
- South Point Casino (Henderson): 22 poker tables
- Green Valley Ranch Casino (Henderson): 22 poker tables
- Red Rock Casino (Summerlin): 20 tables
Historical data and trends of poker in Nevada
For those who are interested, here’s a look at several key poker metrics from the UNLV Center for Gaming Research, which has been tracking the number of poker rooms, tables and revenue since 1992:
| Year | # of Rooms | # of Tables | Total Revenue | % Change YoY |
|---|---|---|---|---|
| 1992 | 92 | 564 | 74,701,000 | -2.57 |
| 1993 | 89 | 571 | 70,814,000 | -5.20 |
| 1994 | 93 | 586 | 71,667,000 | 1.20 |
| 1995 | 92 | 574 | 66,520,000 | -7.18 |
| 1996 | 82 | 539 | 64,485,000 | -3.06 |
| 1997 | 77 | 490 | 61,509,000 | -4.61 |
| 1998 | 76 | 526 | 58,873,000 | -4.29 |
| 1999 | 70 | 546 | 63,244,000 | 7.41 |
| 2000 | 68 | 473 | 63,064,000 | -0.28 |
| 2001 | 65 | 475 | 59,673,000 | -5.38 |
| 2002 | 57 | 386 | 57,791,000 | -3.15 |
| 2003 | 58 | 383 | 68,276,000 | 18.15 |
| 2004 | 79 | 484 | 98,862,000 | 44.80 |
| 2005 | 96 | 701 | 140,224,000 | 42.00 |
| 2006 | 106 | 886 | 160,929,000 | 14.77 |
| 2007 | 113 | 907 | 167,975,000 | 4.38 |
| 2008 | 113 | 913 | 155,724,000 | -7.29 |
| 2009 | 114 | 905 | 145,580,000 | -6.54 |
| 2010 | 109 | 920 | 135,200,000 | -7.13 |
| 2011 | 104 | 872 | 131,877,000 | -2.46 |
| 2012 | 99 | 809 | 123,253,000 | -6.54 |
| 2013 | 88 | 774 | 123,891,000 | 0.56 |
| 2014 | 79 | 736 | 119,904,000 | -3.18 |
| 2015 | 76 | 681 | 118,023,000 | -1.57 |
| 2016 | 73 | 661 | 117,753,000 | -0.18 |
| 2017 | 71 | 615 | 118,455,000 | 0.60 |
| 2018 | 62 | 599 | 120,010,000 | 1.33 |
The post Nevada Poker Rooms Post Their Best January Since 2015 appeared first on .


 Visit WSOP NJ


