A solid April has the Nevada poker industry on pace for its best year since 2011. The ongoing reduction in poker rooms and poker tables across the state makes that accomplishment all the more impressive.
Despite fewer tables, revenues have increased year-over-year in each of the first four months of 2019. Those increases haven’t been trivial, either.
2019 Y/Y revenue changes as reported by the Nevada Gaming Control Board:
- January 2019: +6.52%
- February 2019: +3.79%
- March 2019: +6.30%
- April 2019: +4.05%
Play Online Poker for Real Cash Prizes – US Players Accepted
-
 Visit Global Poker – US Players Accepted
- JackPot Sit N GoWin Up To 4000 On Entry of 2
- Global Poker – US Players Accepted ReviewOverall Grade A
- Games B+
- Support A
- Banking A+
- Signup Bonus A
A look inside this month’s revenue numbers
The number of poker rooms and tables in the state was pretty stagnant month-over-month. The NGCB counted 58 poker rooms and 555 poker tables in its latest monthly report. That’s an increase of one room and a loss of one table compared to last month.
As usual, the year-over-year numbers show significant drops on both counts. Nevada boasted 64 poker rooms and 585 poker tables in April 2018.
Once again, with the Y/Y revenue gains, April 2019 outperformed April 2018 on a per table basis:
- April 2018 table average: $14,033
- April 2019 table average: $15,558
2018/2019 live poker revenue in Nevada
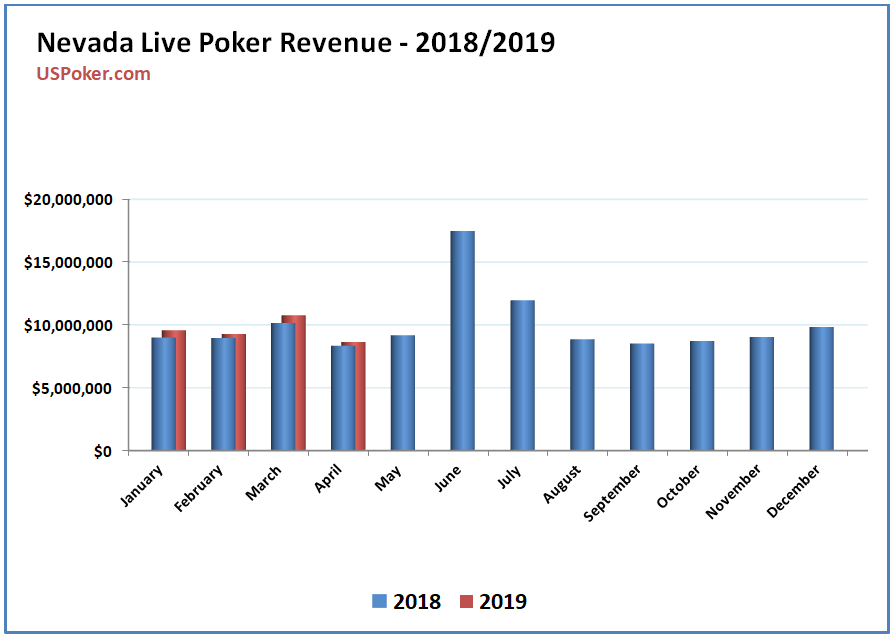
WSOP ushers in the busy season
From late-May to mid-July, the World Series of Poker (WSOP) swells the number of poker tables in the city of Las Vegas. It also causes a spike in poker revenue (see chart below).
This year is the 50th anniversary of the WSOP. Couple that with a renewed interest in poker (attendance has been trending up in recent years), and this WSOP has the potential to be a record-setter.
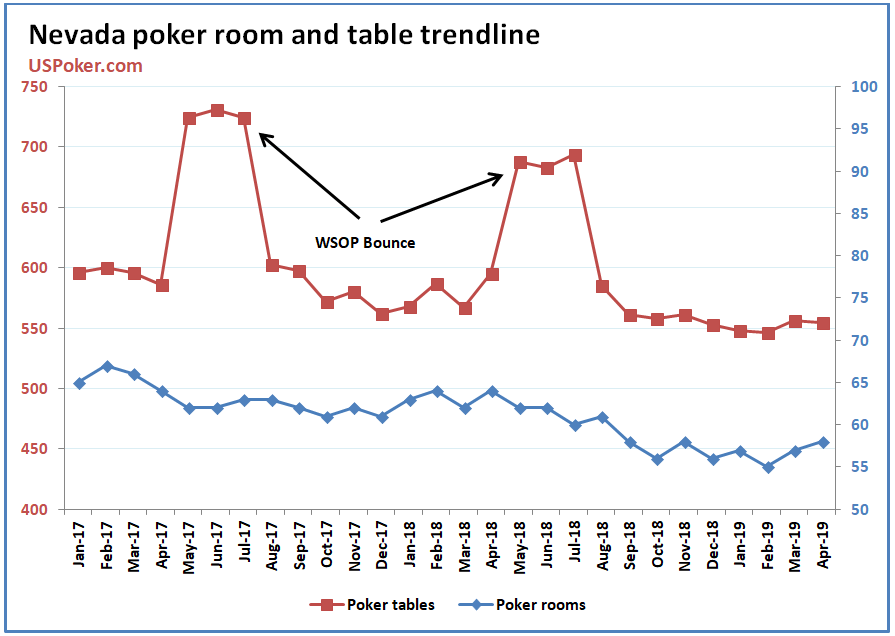
3- and 12-month poker room and table trend
Over the last three months, Nevada has averaged 553 poker tables at 58 separate locations. Those rooms generated $28,723,000 over that period, a 4.92% increase compared to the same period last year.
Over the last 12 months Nevada has averaged 590 poker tables at 62 locations. During that time the state’s poker operators have generated $121,943,000, a 2.52 percent increase compared to the previous 12-month period.
- May 2018: 62 poker rooms and 688 poker tables
- June 2018: 62 poker rooms and 683 poker tables
- July 2018: 60 poker rooms and 694 poker tables
- August 2018: 61 poker rooms and 585 poker tables
- September 2018: 58 poker rooms and 561 poker tables
- October 2018: 56 poker rooms and 558 poker tables
- November 2018: 58 poker rooms and 561 poker tables
- December 2018: 56 poker rooms and 553 poker tables
- January 2019: 57 poker rooms and 548 poker tables
- February 2019: 55 poker rooms and 546 poker tables
- March 2019: 57 poker rooms and 556 poker tables
- April 2019: 58 poker rooms and 555 poker tables
Nevada poker rooms by the numbers
The largest poker rooms in Las Vegas are mainly found on the Las Vegas Strip:
- Venetian (The Strip) – 37 poker tables
- Bellagio (The Strip) – 37 poker tables
- Orleans (Las Vegas off-strip)- 35 poker tables
- Wynn (The Strip) – 28 poker tables
- Aria (The Strip) – 24 poker tables
- South Point Casino (Henderson) – 22 poker tables
- Green Valley Ranch Casino (Henderson) – 22 poker tables
- Red Rock Casino (Summerlin) – 20 tables
Historical data and trends of poker in Nevada
Here’s a look at several key poker metrics from the UNLV Center for Gaming Research, which has been tracking the number of poker rooms, tables and revenue since 1992:
| Year | # of Rooms | # of Tables | Total Revenue | % Change YoY |
|---|---|---|---|---|
| 1992 | 92 | 564 | 74,701,000 | -2.57 |
| 1993 | 89 | 571 | 70,814,000 | -5.20 |
| 1994 | 93 | 586 | 71,667,000 | 1.20 |
| 1995 | 92 | 574 | 66,520,000 | -7.18 |
| 1996 | 82 | 539 | 64,485,000 | -3.06 |
| 1997 | 77 | 490 | 61,509,000 | -4.61 |
| 1998 | 76 | 526 | 58,873,000 | -4.29 |
| 1999 | 70 | 546 | 63,244,000 | 7.41 |
| 2000 | 68 | 473 | 63,064,000 | -0.28 |
| 2001 | 65 | 475 | 59,673,000 | -5.38 |
| 2002 | 57 | 386 | 57,791,000 | -3.15 |
| 2003 | 58 | 383 | 68,276,000 | 18.15 |
| 2004 | 79 | 484 | 98,862,000 | 44.80 |
| 2005 | 96 | 701 | 140,224,000 | 42.00 |
| 2006 | 106 | 886 | 160,929,000 | 14.77 |
| 2007 | 113 | 907 | 167,975,000 | 4.38 |
| 2008 | 113 | 913 | 155,724,000 | -7.29 |
| 2009 | 114 | 905 | 145,580,000 | -6.54 |
| 2010 | 109 | 920 | 135,200,000 | -7.13 |
| 2011 | 104 | 872 | 131,877,000 | -2.46 |
| 2012 | 99 | 809 | 123,253,000 | -6.54 |
| 2013 | 88 | 774 | 123,891,000 | 0.56 |
| 2014 | 79 | 736 | 119,904,000 | -3.18 |
| 2015 | 76 | 681 | 118,023,000 | -1.57 |
| 2016 | 73 | 661 | 117,753,000 | -0.18 |
| 2017 | 71 | 615 | 118,455,000 | 0.60 |
| 2018 | 62 | 599 | 120,010,000 | 1.33 |
The post Why Reducing The Number Of Poker Tables In Nevada Isn’t A Problem appeared first on .